Generating Beautiful Flowchart Diagrams With Mermaid and Vue/Nuxt
Hey folks, today I want to show you how to generate flowchart diagrams in a Vue or Nuxt application using vue-mermaid-string and nuxt-mermaid-string. They both help to integrate the wonderful Mermaid library into your Vue-based projects.
Setup
Alright, let's stick to Vue for now and see later how it works for Nuxt. First we need to install the component.
There are several ways to add the component to your project. The quickest solution is via CDN like this:
<script src="https://unpkg.com/vue"></script>
<script src="https://unpkg.com/mermaid/dist/mermaid.min.js"></script>
<script src="https://unpkg.com/vue-mermaid-string"></script>
Note that you also need to add mermaid itself.
Alternatively, install it via a package manager:
$ npm install vue-mermaid-string
And register the component. You can do it locally:
<script>
import VueMermaidString from 'vue-mermaid-string'

export default {
  components: {
    VueMermaidString,
  },
}
</script>
Globally:
import Vue from 'vue'
import VueMermaidString from 'vue-mermaid-string'

Vue.component('VueMermaidString', VueMermaidString)
Or as a plugin:
import Vue from 'vue'
import VueMermaidString from 'vue-mermaid-string'

Vue.use(VueMermaidString)
Let's draw some serious stuff
Alright, now let's start drawing a diagram! Since probably most of the readers are JavaScript fans, we create a little tech tree for demonstration purposes 😊.
Here is the code needed to display the diagram. We also add endent to make life easier with multi-line strings.
<template>
  <div id="app">
    <vue-mermaid-string :value="diagram" />
  </div>
</template>
<script>
import VueMermaidString from "vue-mermaid-string";
import endent from "endent";

export default {
  computed: {
    diagram: () => endent`
      graph TD
        DateTime[Date and time]

        JavaScript --> Frameworks
        JavaScript --> DateTime
        JavaScript --> 3D
        Frameworks --> Vue.js
        Frameworks --> React
        DateTime --> Moment.js
        DateTime --> date-fns
        3D --> Three.js
        3D --> Babylon.js
    `,
  },
  components: {
    VueMermaidString,
  },
};
</script>
This results in the following diagram:
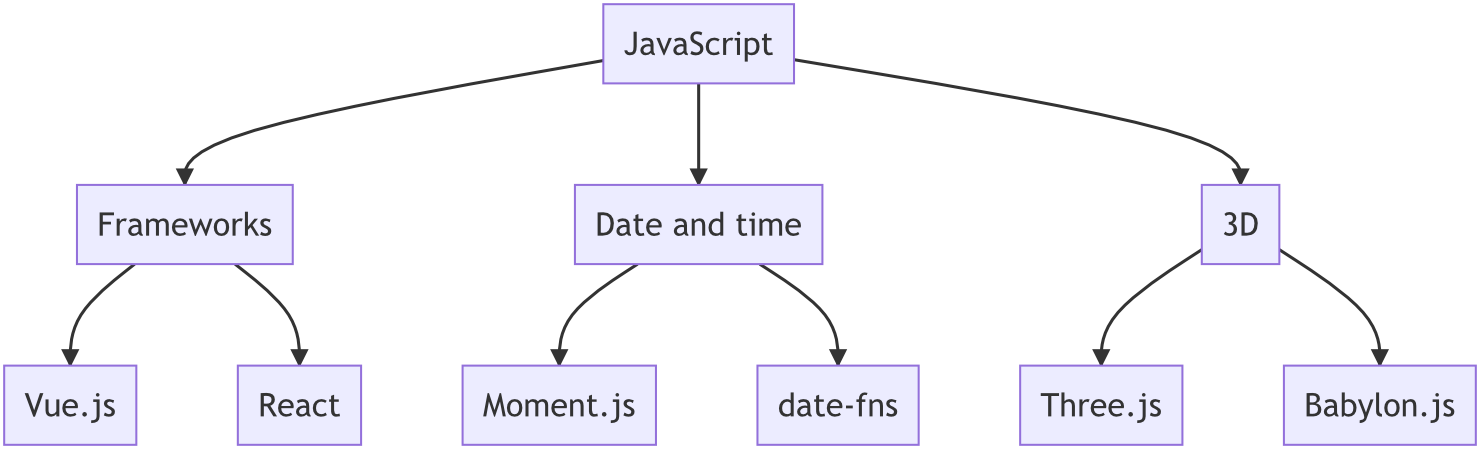
Great! You can also edit the diagram string (for example the node labels), and it updates the result accordingly.
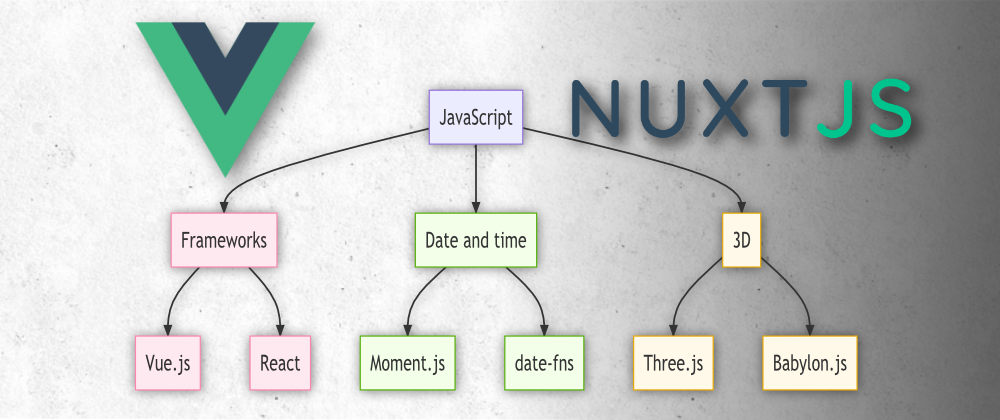
As a next step we change the colors for each library type. I've used Paletton to generate a tetradic color scheme and applied the colors to the corresponding nodes.
I've put the result into a sandbox with source code, the result looks like this:
Feel free to play around with the sandbox and try out different Mermaid strings!
Usage with Nuxt
If you are a Nuxt user, it is probably more convenient to add a module to your project and then have everything available right away. There is nuxt-mermaid-string, which basically wraps the vue component.
Simply install it via npm install nuxt-mermaid-string.
Then add it to your nuxt.config.js like this:
export default {
  modules: ['nuxt-mermaid-string'],
}
And there we go. The rest works like above!
Conclusion
In this article we had a look at diagram generation in Vue and Nuxt apps. I hope you liked it and it's of some use for you!
You help me know if people like the packages by leaving a GitHub star at vue-mermaid-string and/or nuxt-mermaid-string 🌟.
If you like what I'm doing, follow me on Twitter or check out my website. Also consider donating at Buy Me a Coffee, PayPal or Patreon. Thank you so much! ❤️